I built a cycling heatmap webapp
A friend and me are passionate cyclists and of course you can find us on strava. But even better, both of us are passionate developers in our spare time. We decided to give stravas api a spin just for fun.
Having used VeloViewer to crunch our performance data even more, we thought we might be able to enhance our planning in VeloViewers “ride every tile” feature.
Alpha Prototype was done in Python. Which was then ported to JavaScript.
- Extracting GPS Points into (Map)Tiles of different sizes
- Calculating the different scores, like clusters, max square and totals
And soon after:

A bit of tinkering here and there, we thought it was good enough to have the evening efforts wrapped in a product and share it with our friends.
So in the end, all code was poured into a NuxtJS frontend, backed by Ruby, namely Roda, Sequel, Rodauth and a Postgres Database.
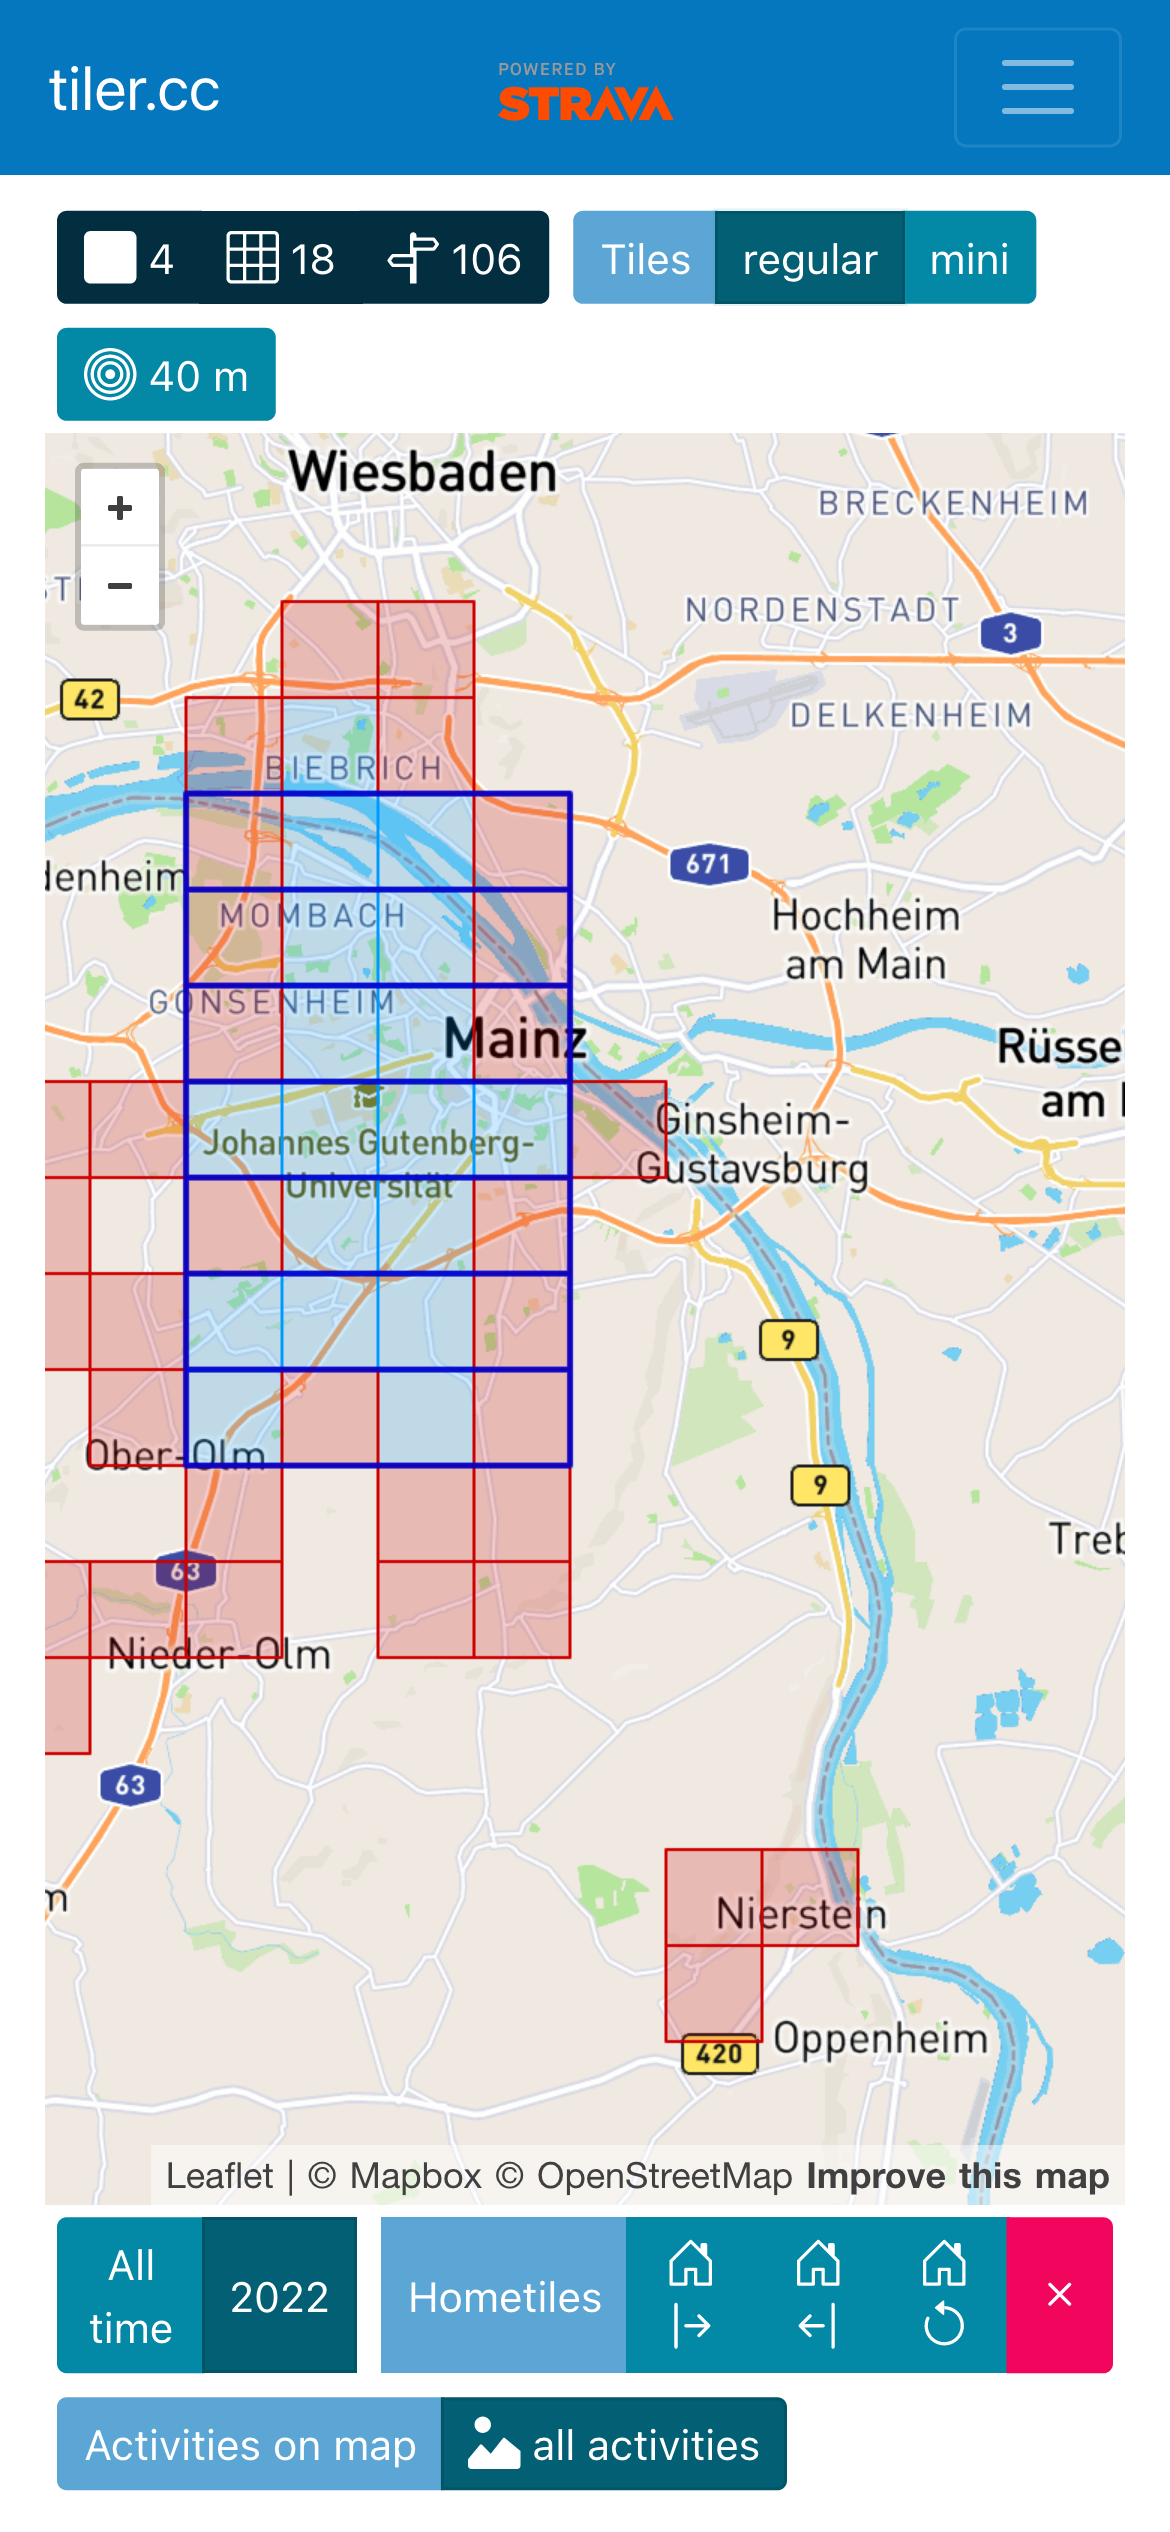
Feature: Interactive Ride Map / Ridden Tiles
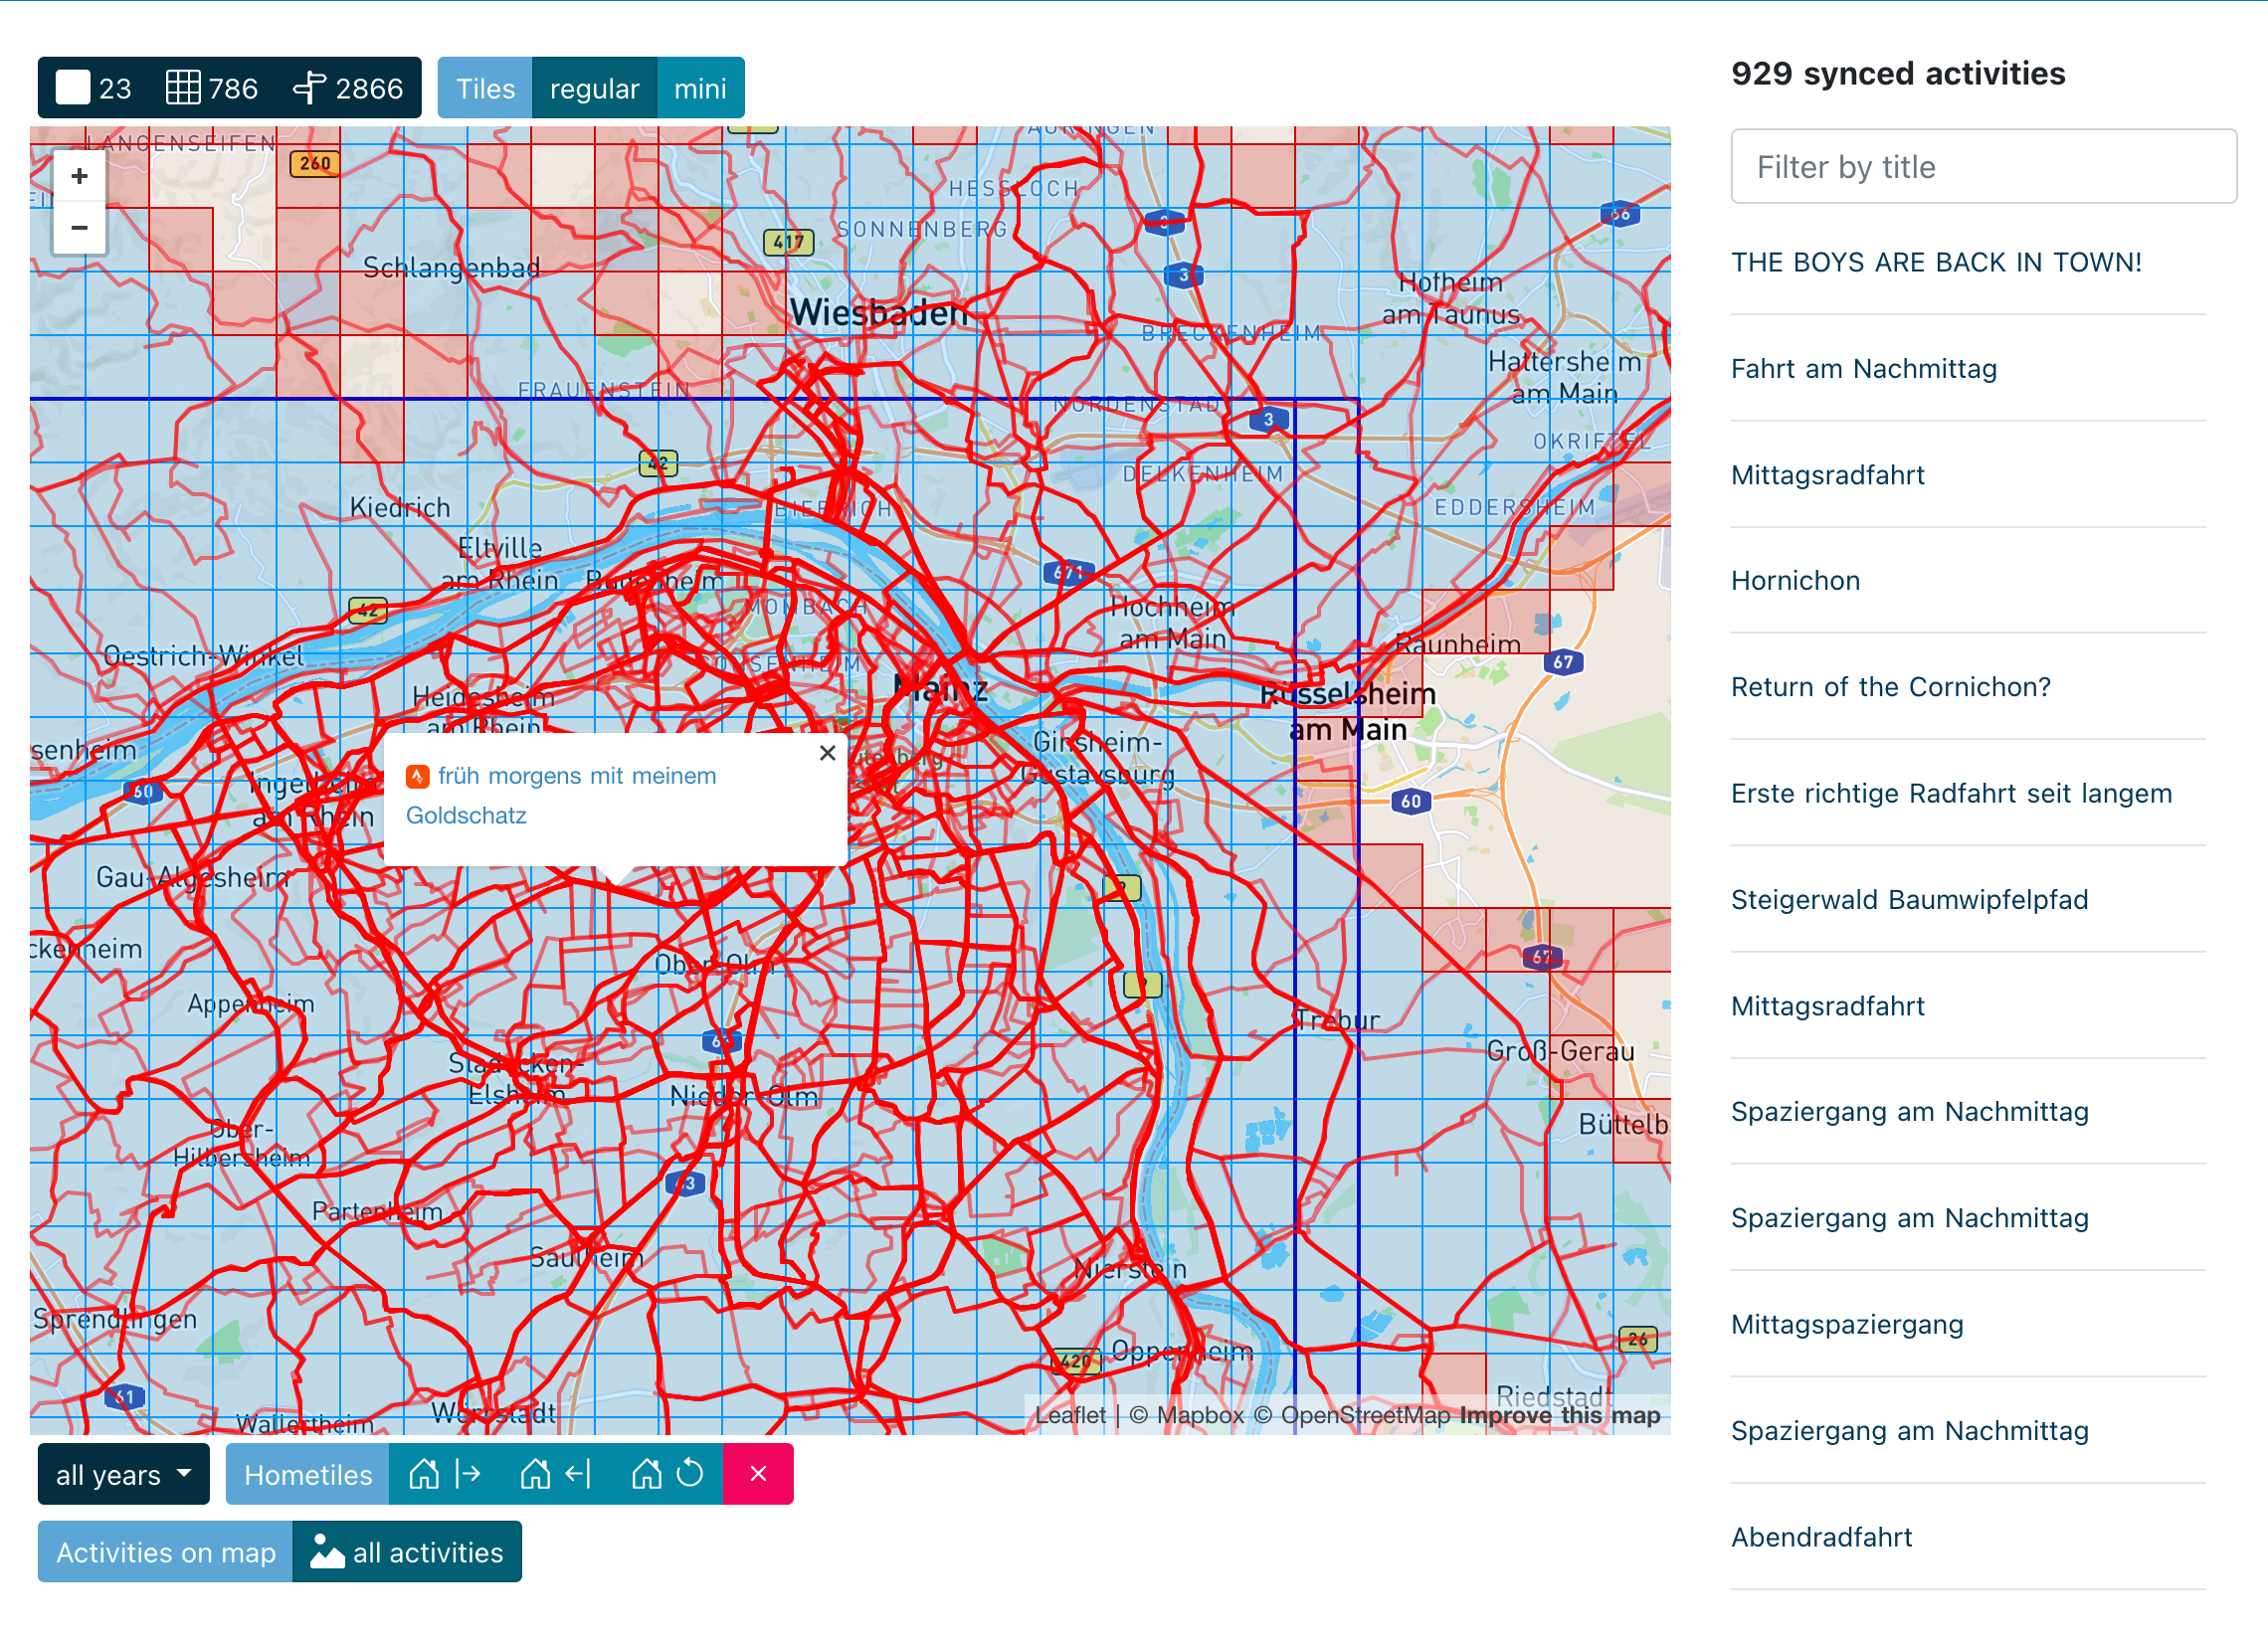
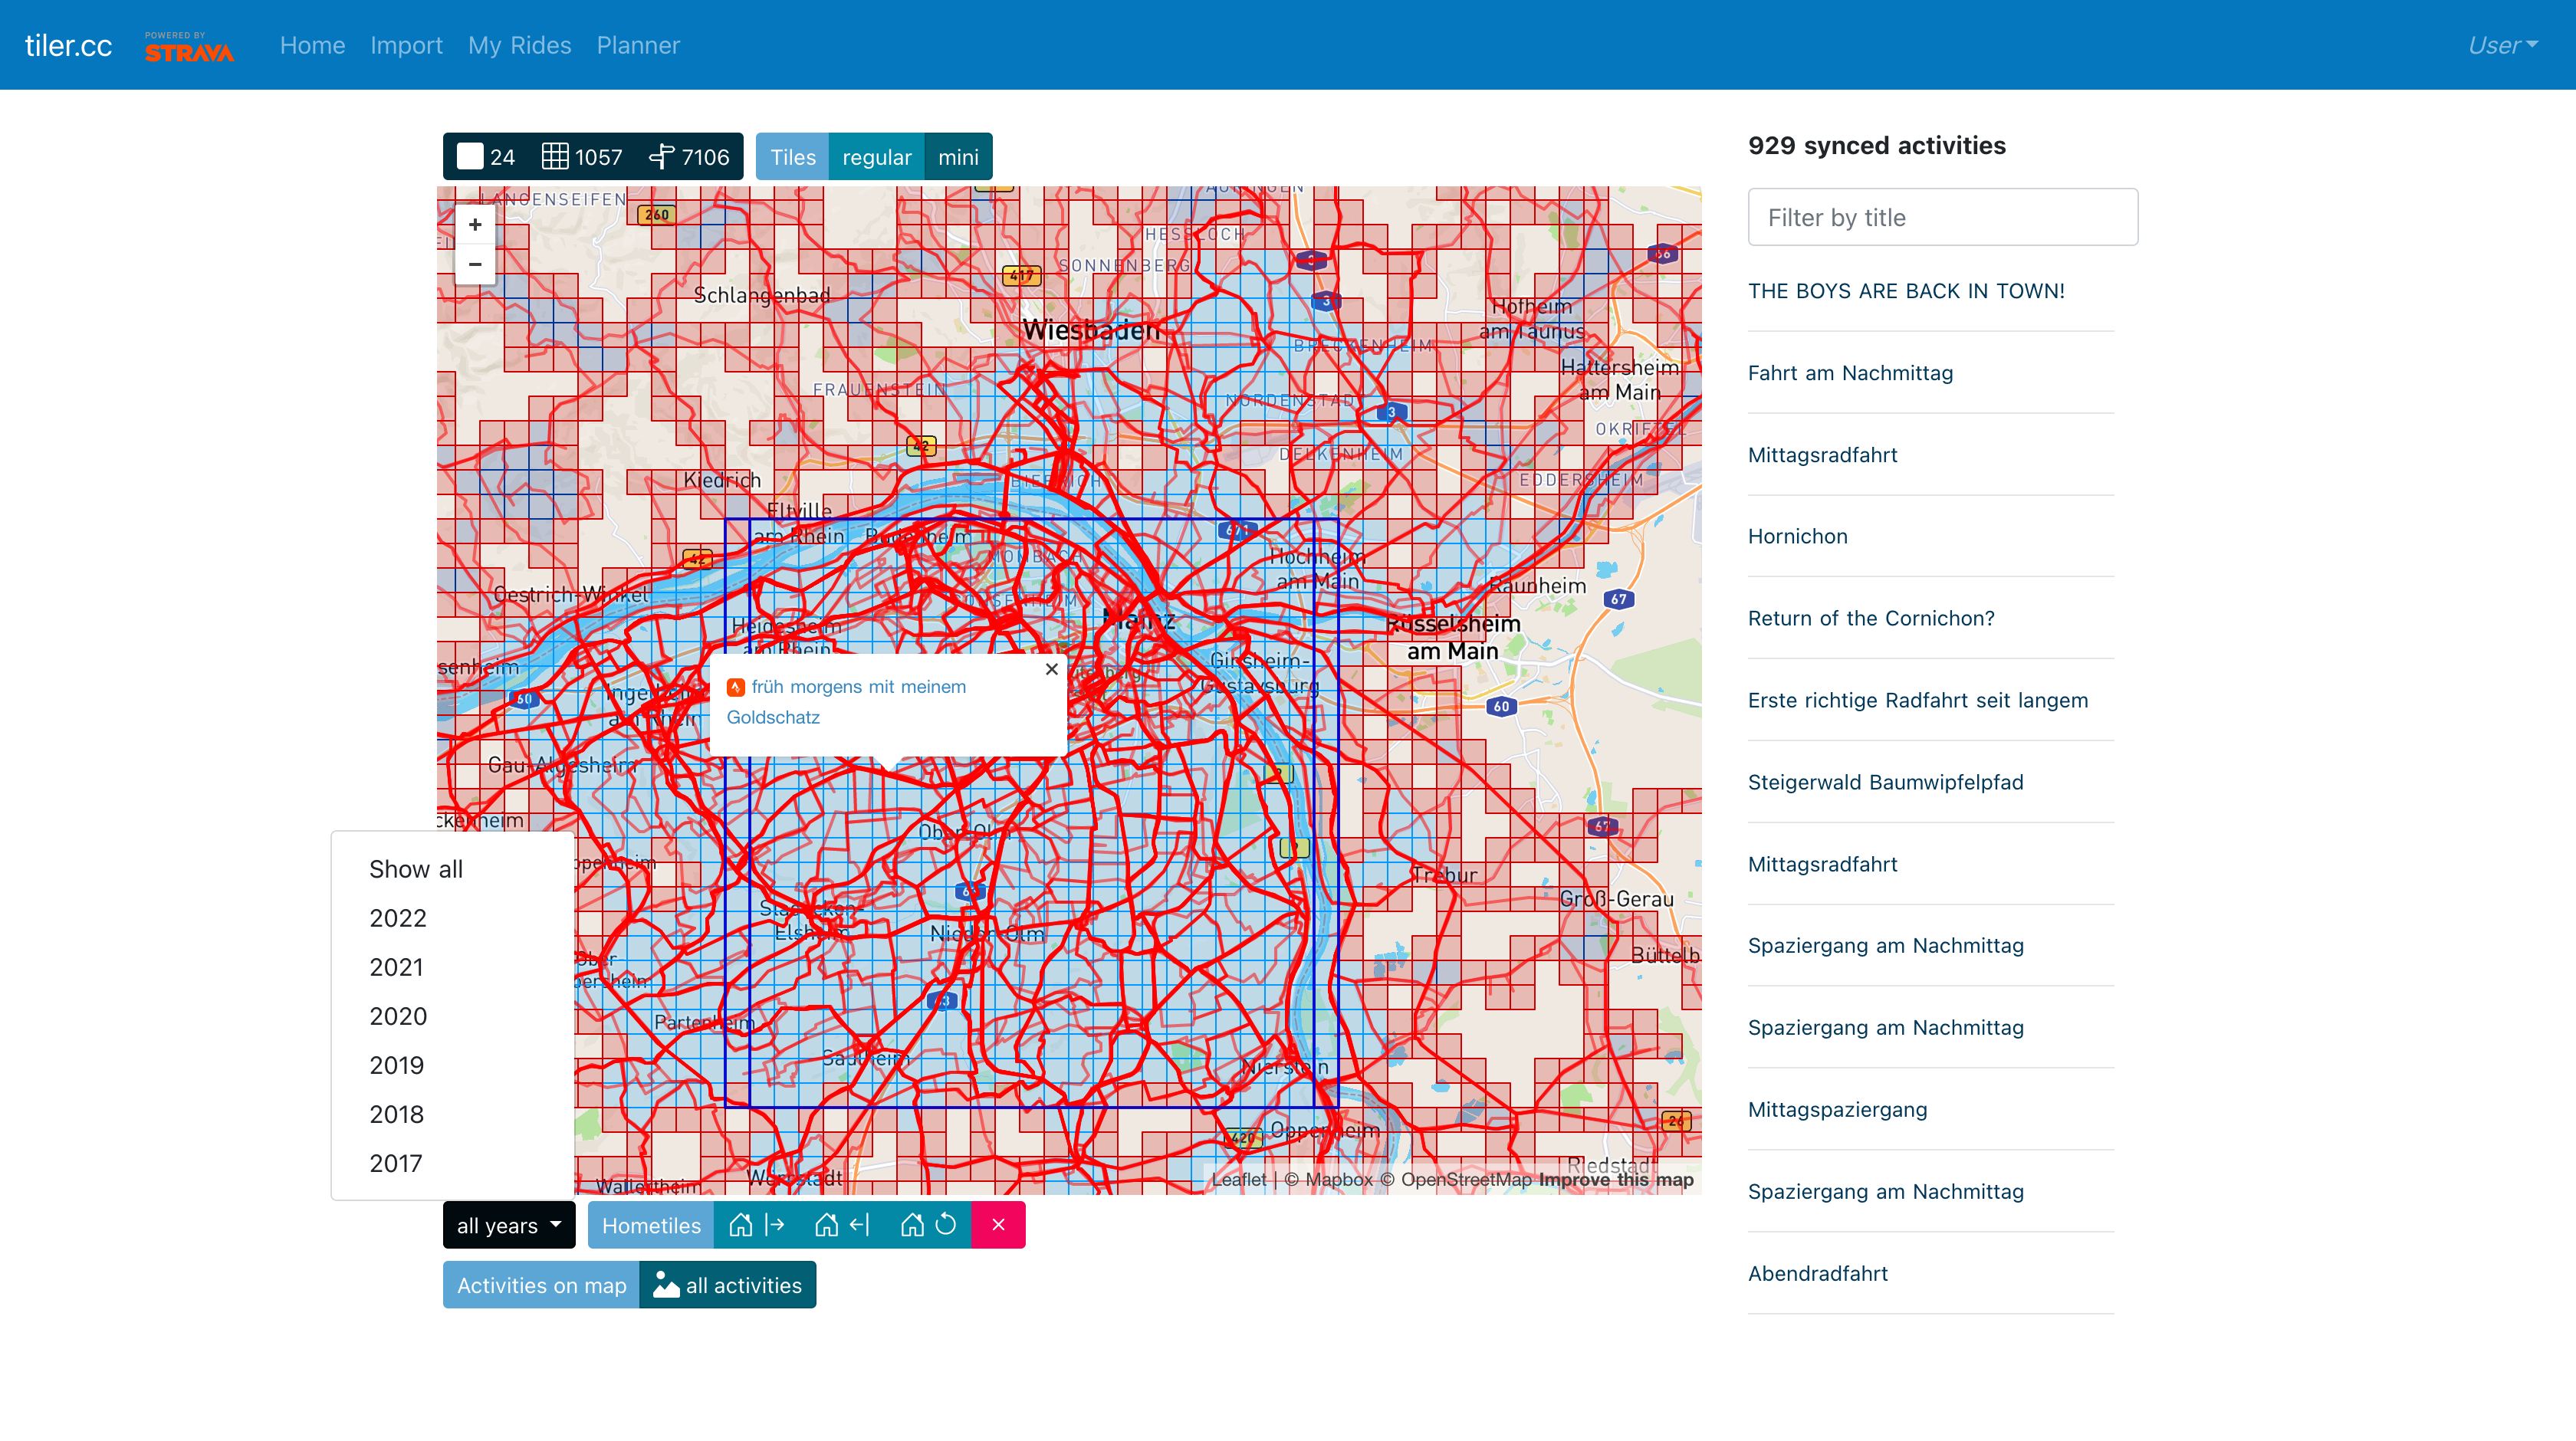
Feature: Time component
we put a little more work in, giving us features like:
- have the data sliced by year
- nicer import from strava
- more api mappings
- nicer background jobs (though, I never was really proud of it 😬)
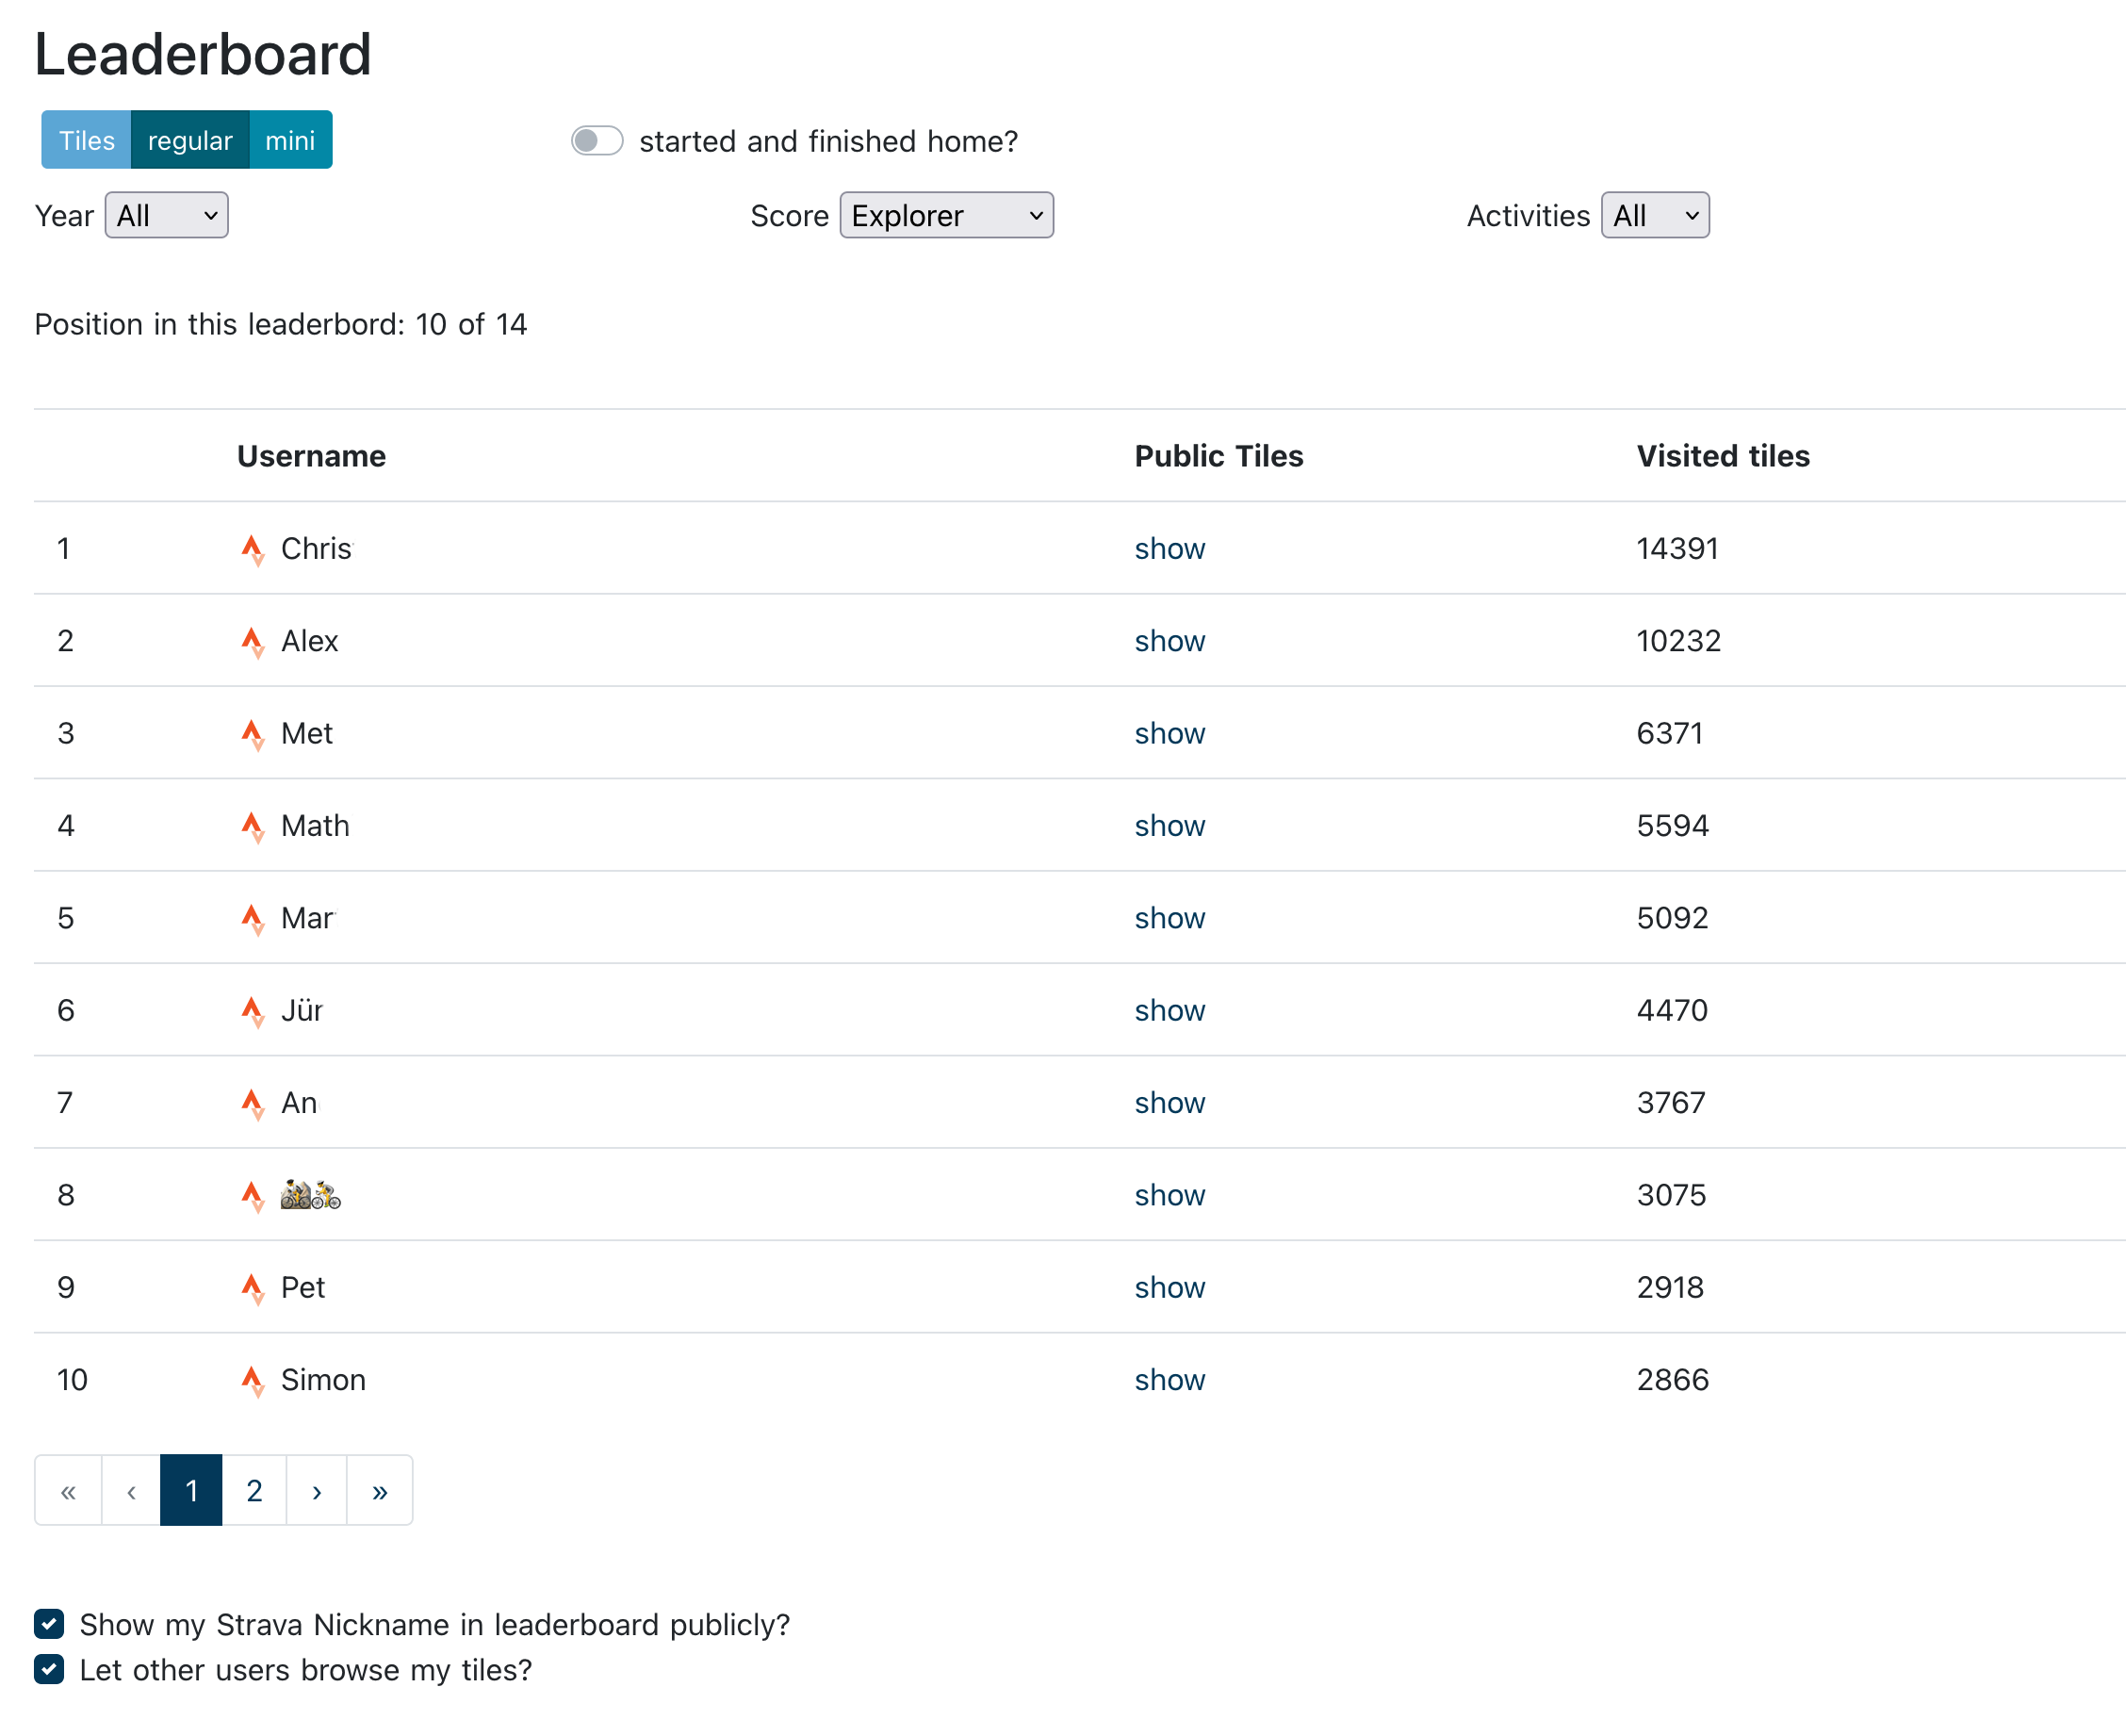
Feature: Leaderboard
of course our friends wanted to know, who got around the most 🚀
- friends could permit to show their score
- friends could permit to let others view their tiles (without paths, to hide where they live)
Feature: Planner
In order to plan where you haven’t been, user were enabled to set points on a map. User were then able to export the .gpx file, allowing them to create a routing file (by mostly using komoot) - which would then be automagically synced to their gps bike computer (Wahoo/Garmin). This really is a thing, everybody owns one 😎
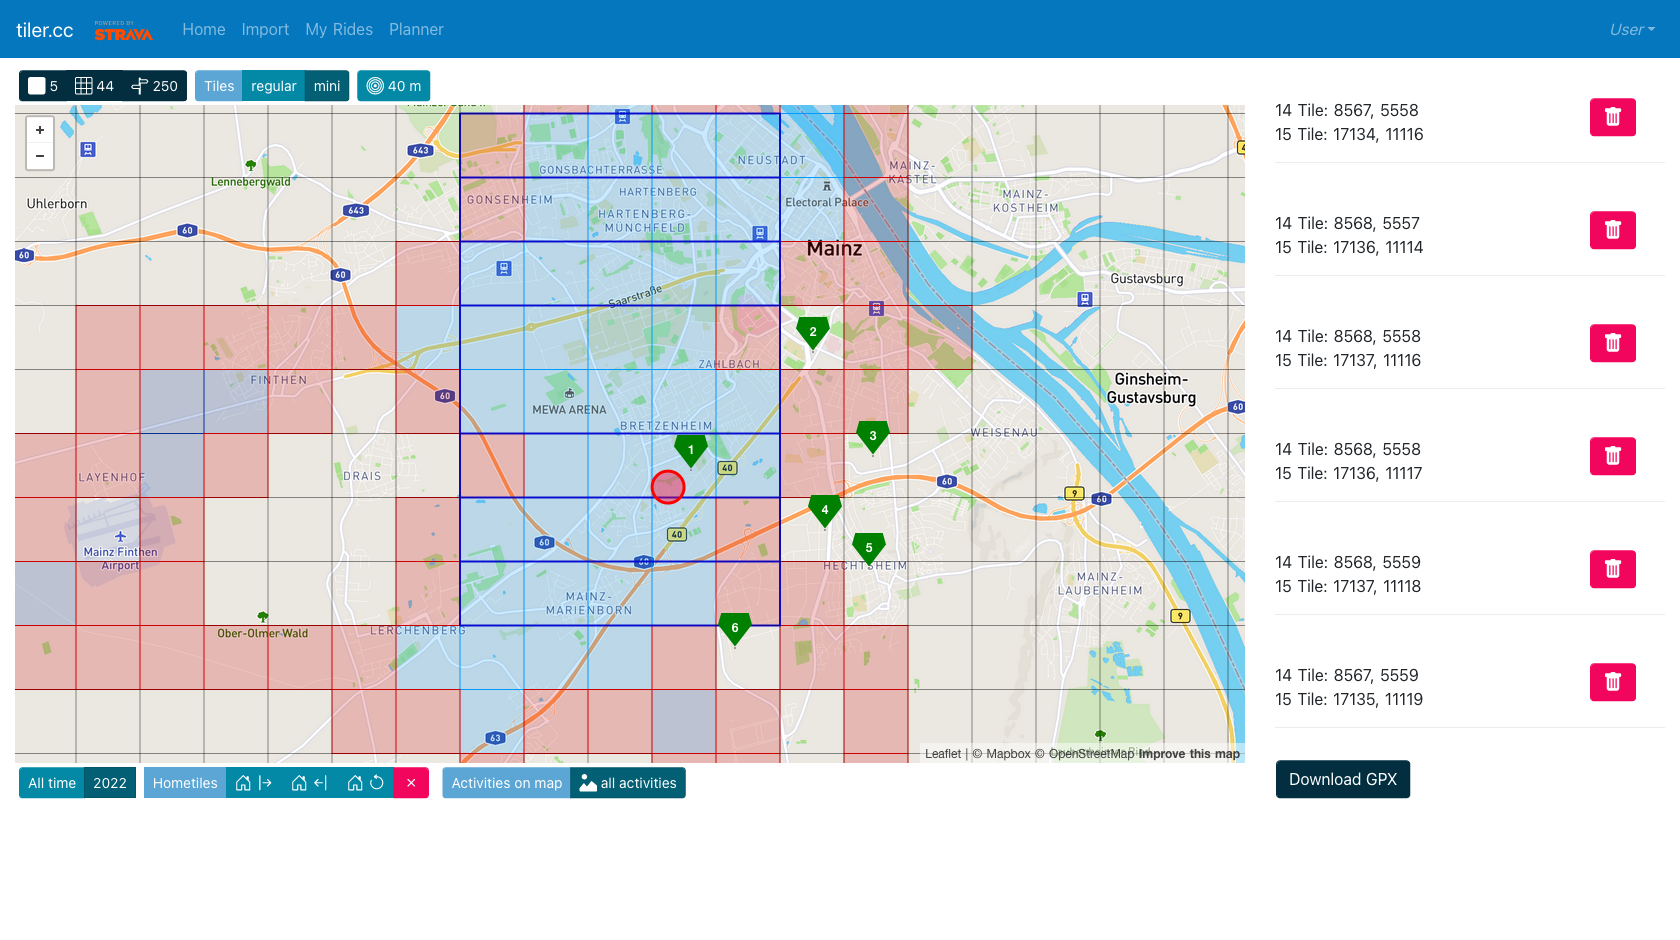
Feature: Check your current position
At times there were tiles, which would be rather demanding. The Frankfurt Airport for example. So users wanted to make sure, their gps is picking signal and they would later have the tile being counted as visited.
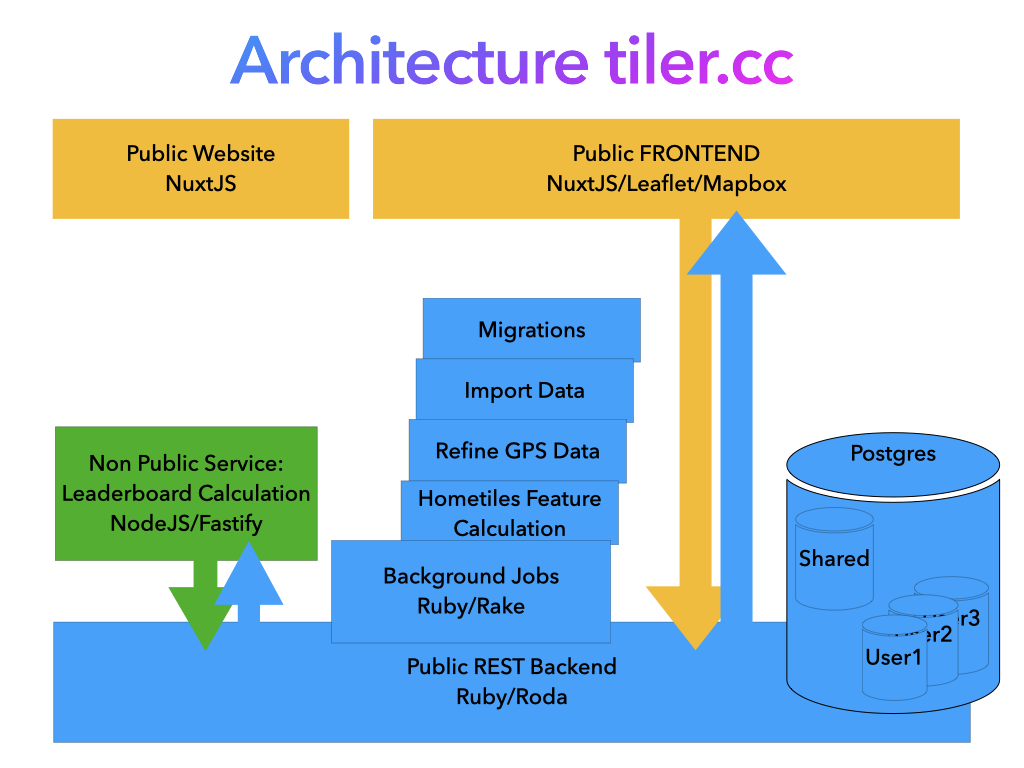
Technical Setup May 2022
Postgres runs on bare metal, being limited to localhost.
All other web related apps were dockered (easy scaling) and their traffic was proxied through traefik, enabling SSL encryption by letsencrypt.
Additional services and background jobs were setup using Rake and would be restarted by docker policy restart unless-stopped once they finished/terminated.
Logging via docker 😅 was enough to debug what was coming.
A staging environment on netcups cheapest VPS was good enough for debugging what didn’t reveal itself in development.
Calculating tile scores and leaderboard scores is done in a NodeJS fastify api backend, which isn’t exposed to the web, just the ruby backend.
⬅️ Read previous Read next ➡️